Using Reports
Laserfiche Forms 10.2 or earlier supports dashboards and reports that you can use to identify issues, glance at data, and filter time periods. Laserfiche Forms 10.3 includes the same functionality and more for one or more processes. Laserfiche Forms 10.4.2 introduces additional reports and functionality. This document describes how you can use the analytics features in each version of Laserfiche Forms.
Laserfiche Forms 10.4.2
Insights
Insights provides access to a new set of reports that include the Process Overview (previously Operational Reports), Performance, Task Loads, and Workload reports. Only Admins and Business Managers (for the selected process) can view and share these reports,

Process Overview
Process Overview reports detail data about one process. The data includes instance, duration, and distribution overviews. ![]() See what this looks like.
See what this looks like.
Performance
Performance reports detail the performance data about how quickly your process instances are being completed. The time it takes an instance to be completed is known as the cycle time. ![]() See what this looks like.
See what this looks like.
Task Loads
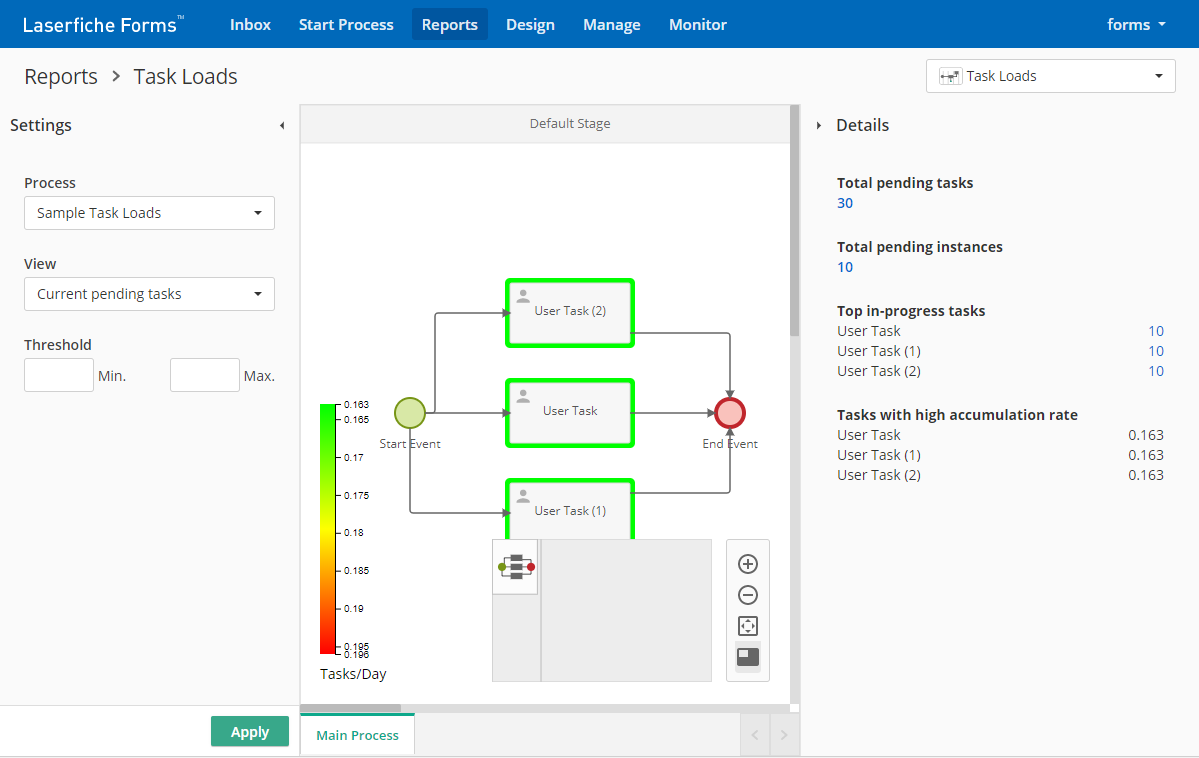
Task Loads reports let you view which user tasks in a process are accumulating too many tasks and potentially creating bottlenecks. By selecting the process of interest and adding other criteria, you can generate a heat map that color-codes user tasks according to how many pending tasks they have or how many tasks they've accumulated per day. ![]() See what this looks like.
See what this looks like.
Workload
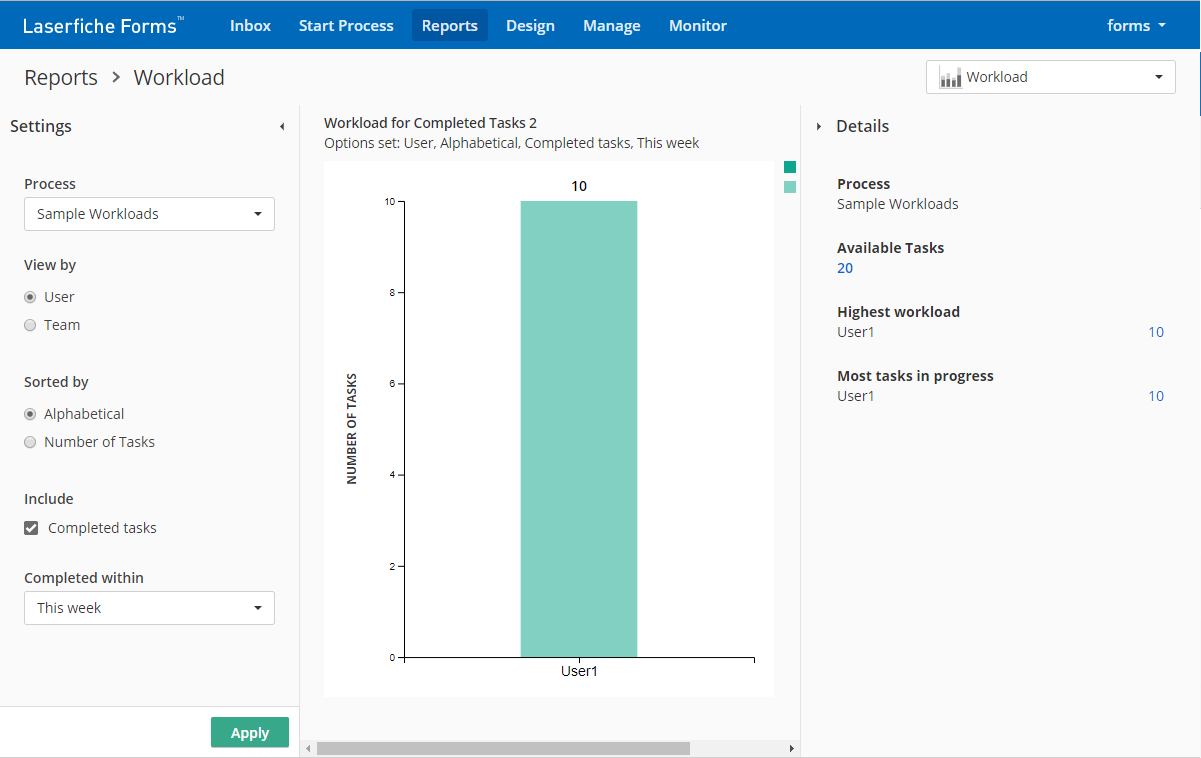
Workload reports let you view how in-progress and completed tasks are distributed over users or teams. ![]() See what this looks like.
See what this looks like.
Custom Reports
Custom reports provide details about instance data for multiple processes on one report type. Only Process Admin and Business Managers (for all the processes in the report) can create and modify the custom report. This section describes how you can generate and download a custom report.
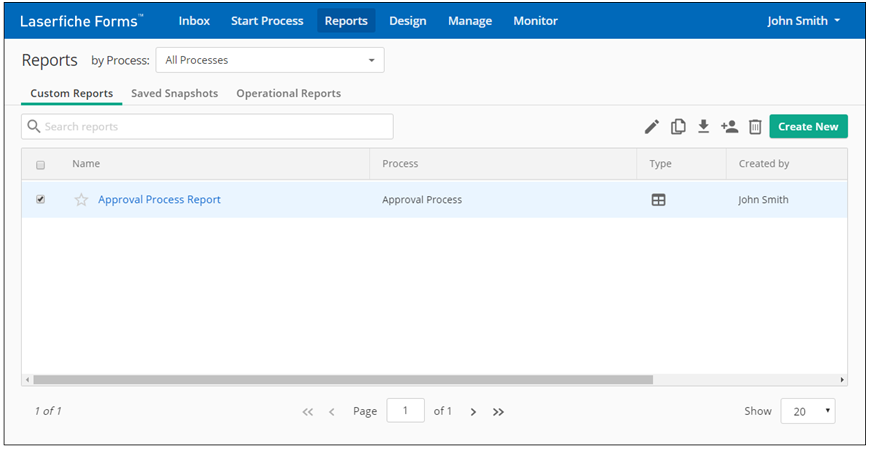
Generating a Custom Report
- Click Create New.
- Select a report type, click Select.
- Select the processes you want to report on, click Select.
- Specify the name and visibility of the report, click Next.
- Configure report settings.
- Click Create.
You can manage access and add data markers to and update the data on the generated report in the top right of the report. You can save the report, filters, and column configuration using saved snapshots. Learn more about saved snapshots
Downloading a Custom Report
- Open a custom report.
- Click Download in the top right.
- Select a file type and download method.
- Click Download.
Saved Snapshots
Saved snapshots capture a report when you take the snapshot. The snapshot includes the report type, filters, and column configuration, and excludes the underlying data in the snapshot. This section describes how you can create, download, and manage access to a snapshot.
Creating a Saved Snapshot
- Create a custom report.
- In the custom report, click Save Snapshot on the top right.
- Provide a name for the snapshot, as well as who you want to let view the snapshot.
- Click Create.
Downloading a Saved Snapshot
- On the Reports page, open the Saved Snapshots tab.
- Select a saved snapshot. You can download one saved snapshot at a time.
- Click Download on the top right.
- Select a file type and download method.
- Click Download.
Managing Access to Multiple Snapshots
You can only manage access to saved snapshots when you are the system admin or creator of the snapshots.
- On the Reports page, open the Saved Snapshots tab.
- Select more than one snapshot of which you are the system admin or creator.
- Click Manage Access in the top right.
- In the dialog, add or remove member access. You can only manage access the selected snapshots when the selected snapshots are visible to the same users and groups.
- Click Update.
Report Schedules
Report schedules let you generate a saved snapshot based on a schedule, instead of generating one manually. Anyone who can view the custom report from which the snapshot is generated can also view the report schedule. This section describes how you can create a report schedule.
Creating a Report Schedule
You can create a report schedule in the Report Schedules tab or the Custom Reports tab, and then view it in the Report Schedules tab.
To create a report schedule in the Report Schedules tab:
- On the Reports page, open the Report Schedules tab.
- Click Create Schedule on the top right.
- Select the existing report you want to save based on a schedule.
- In the dialog, set the schedule.
- Optional: Save the report to a Laserfiche Repository.
Note: You need to create a Repository profile if there are no profiles existing to connect to a repository, and then select the location within the repository to save the report.
- Optional: Set up an email notification to notify the users that the snapshot is available and, at the bottom, include the snapshot in an attachment or URL.
Note: Only named users can access saved snapshots using the emailed URL.
- Click Set Schedule.
- Enter the name and visibility for the generated snapshot.
- Click Create.
To create a report schedule in the Custom Reports tab:
- On the Reports page, open the Custom Reports tab.
- Open a custom report.
- Click Create Schedule on the top right.
- Repeat steps 4 – 8 in the previous section.
Managing Access to a Generated Snapshot
You can manage the access and visibility of the snapshot generated by the report schedule.
- On the Reports page, open the Report Schedules tab.
- Select a report schedule.
- On the top right, select the Manage Access button
 .
.
Laserfiche Forms 10.3-10.4.1
Custom Reports
Custom reports provide details about instance data for multiple processes on one report type. Only Process Admin and Business Managers (for all the processes in the report) can create and modify the custom report. This section describes how you can generate and download a custom report.

Generating a Custom Report
- Click Create New.
- Select a report type, click Select.
- Select the processes you want to report on, click Select.
- Specify the name and visibility of the report, click Next.
- Configure report settings.
- Click Create.
You can manage access and add data markers to and update the data on the generated report in the top right of the report. You can save the report, filters, and column configuration using saved snapshots. Learn more about saved snapshots
Downloading a Custom Report
- Open a custom report.
- Click Download in the top right.
- Select a file type and download method.
- Click Download.
Operational Reports
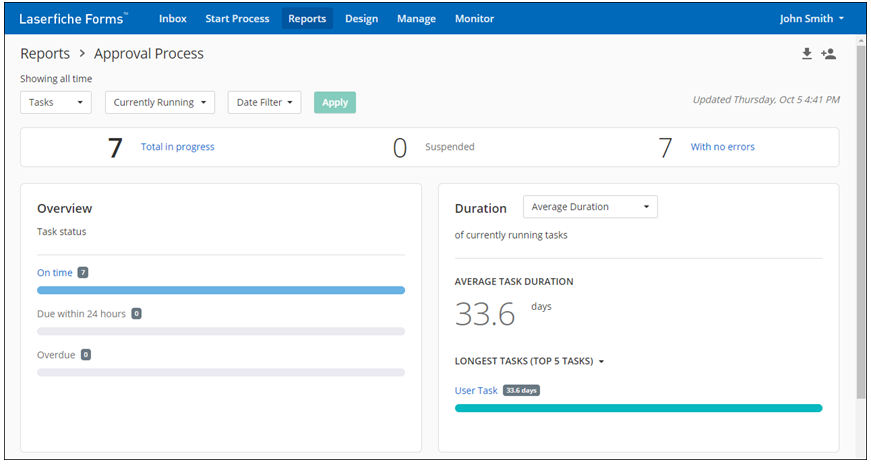
Operational reports detail data about one process. The data includes instance and duration overviews. Only Process Admin and Business Managers (for the selected process) can view and share the operational report.
Saved Snapshots
Saved snapshots capture a report when you take the snapshot. The snapshot includes the report type, filters, and column configuration, and excludes the underlying data in the snapshot. This section describes how you can create, download, and manage access to a snapshot.
Creating a Saved Snapshot
- Create a custom report.
- In the custom report, click Save Snapshot on the top right.
- Provide a name for the snapshot, as well as who you want to let view the snapshot.
- Click Create.
Downloading a Saved Snapshot
- On the Reports page, open the Saved Snapshots tab.
- Select a saved snapshot. You can download one saved snapshot at a time.
- Click Download on the top right.
- Select a file type and download method.
- Click Download.
Managing Access to Multiple Snapshots
You can only manage access to saved snapshots when you are the system admin or creator of the snapshots.
- On the Reports page, open the Saved Snapshots tab.
- Select more than one snapshot of which you are the system admin or creator.
- Click Manage Access in the top right.
- In the dialog, add or remove member access. You can only manage access the selected snapshots when the selected snapshots are visible to the same users and groups.
- Click Update.
Report Schedules
Report schedules let you generate a saved snapshot based on a schedule, instead of generating one manually. Anyone who can view the custom report from which the snapshot is generated can also view the report schedule. This section describes how you can create a report schedule.
Creating a Report Schedule
You can create a report schedule in the Report Schedules tab or the Custom Reports tab, and then view it in the Report Schedules tab.
To create a report schedule in the Report Schedules tab:
- On the Reports page, open the Report Schedules tab.
- Click Create Schedule on the top right.
- Select the existing report you want to save based on a schedule.
- In the dialog, set the schedule.
- Optional: Set up an email notification to notify the users that the snapshot is available and, at the bottom, include the snapshot in an attachment or URL.
Note: Only named users can access saved snapshots using the emailed URL.
- Click Set Schedule.
- Enter the name and visibility for the generated snapshot.
- Click Create.
To create a report schedule in the Custom Reports tab:
- On the Reports page, open the Custom Reports tab.
- Open a custom report.
- Click Create Schedule on the top right.
- Repeat steps 4 – 8 in the previous section.
Managing Access to a Generated Snapshot
You can manage the access and visibility of the snapshot generated by the report schedule.
- On the Reports page, open the Report Schedules tab.
- Select a report schedule.
- On the top right, select the Manage Access button
 .
.
Laserfiche Forms 10.0-10.2
Dashboards
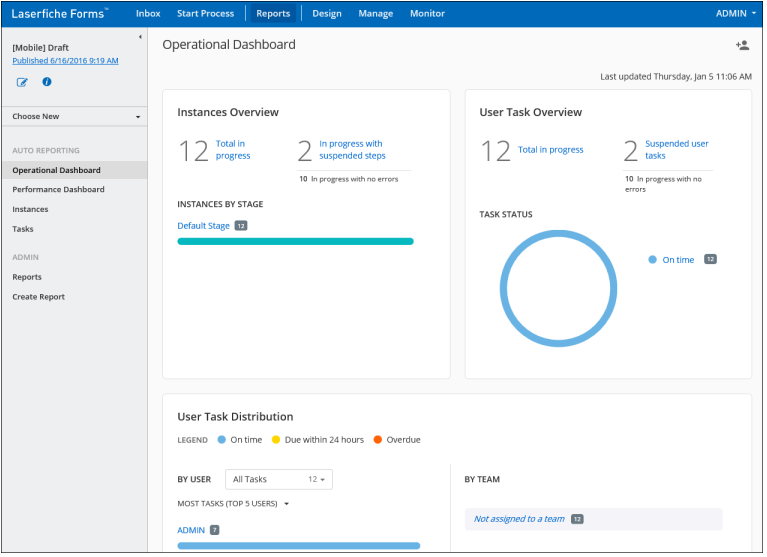
Laserfiche Forms provides two types of visual dashboards.
The Operational Dashboard displays status information on active processes. Use the Operational Dashboard to answer questions like:
- How many instances of a particular process are currently running?
- How many instances are at a particular stage of the process?
- Which tasks in the process are close to reaching their deadline or are already overdue?
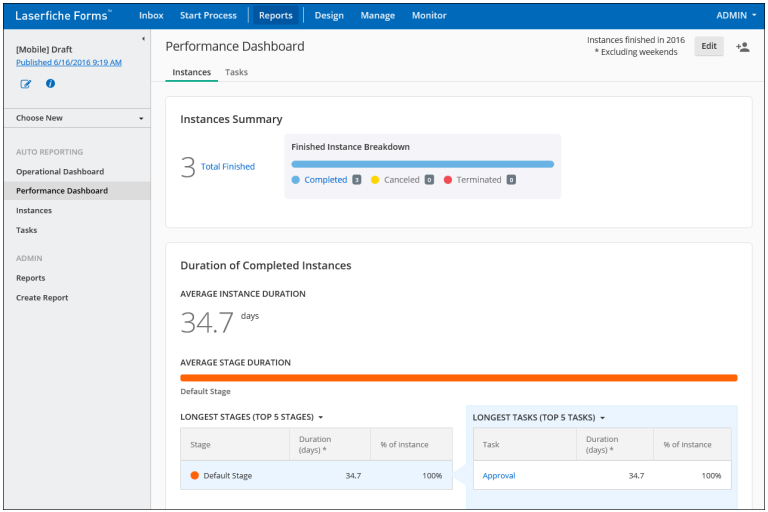
The Performance Dashboard displays metrics on instances completed during specific time periods. Use the Performance Dashboard to answer questions like:
- How many instances of a particular process were started in the last month?
- How many instances of a particular process were completed in the last month?
- How much time does it take on average to complete the process?
After selecting the Performance Dashboard, click Edit in the upper right to modify the desired date range of the report.
Reports
The Reports page shows all of the reports that have been assigned to you. A report is a customized list of instance results for a business process. Process Admins for a business process can create and assign reports to users, enabling them to see instance results that they would otherwise not have access to.
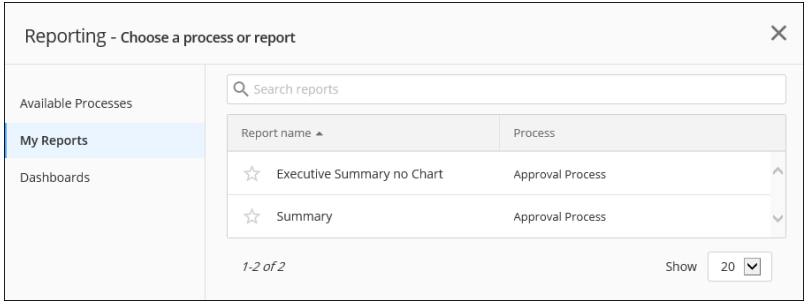
Note: You will only be able to see reports if you are a Process Admin or System Administrator, or if you have been granted access to a report. You can access your reports by selecting Reports from the top menu and viewing the My Reports tab.
To view a report for a business process
Click Reports from the top menu and select from the available processes. In the sidebar, click on Reports to see a table of available reports for the process.
- If you are a System Administrator, the Process Creator for the process, or a Process Admin, you can edit the report from this page by clicking the Edit button.
- Click the download button
 to download or email yourself a XLSX or CSV file with the report data. (More information below)
 - Click the filter button
 to limit the information shown in the report. (More information below)
Creating and Editing Reports
Creating a report
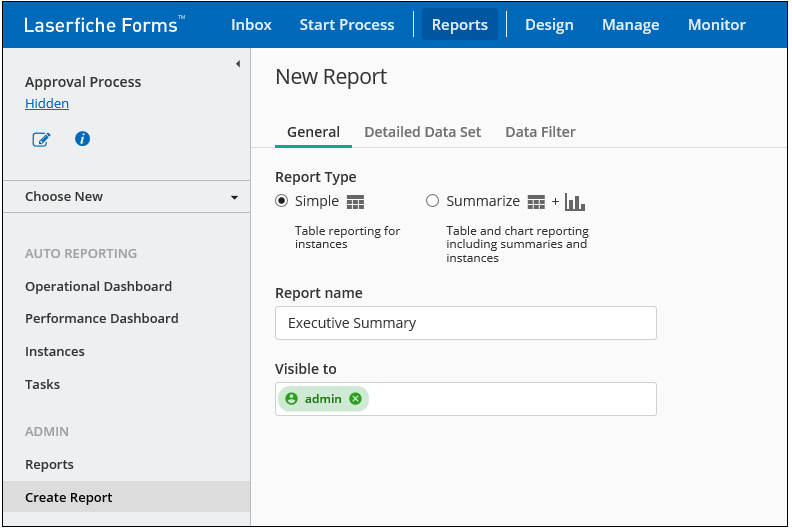
- Click Create Report on from the sidebar.
- Next to Visible to, type the users who will be able to see this report on the Reports page. As you type, an auto-suggested list of users will appear and narrow. Select the user from the list. To add more users, type their names and select them from the list.
- Creating a report involves 3 steps:
- Select between two report presentation styles. Simple features a table of instance data. Summarize includes the table plus options to display summarized data.
- Use the Detailed Data Set and Summarized Data Set tabs to select what columns you want to include in the report.
- Use the Data Filter tab to filter what instances to include in the report.
- When you are finished, click Save.
Tip: You can delete a report by clicking the delete button  .
.
Reports and results can be filtered and downloaded so that you can see the exact information you need in the format that's most convenient.
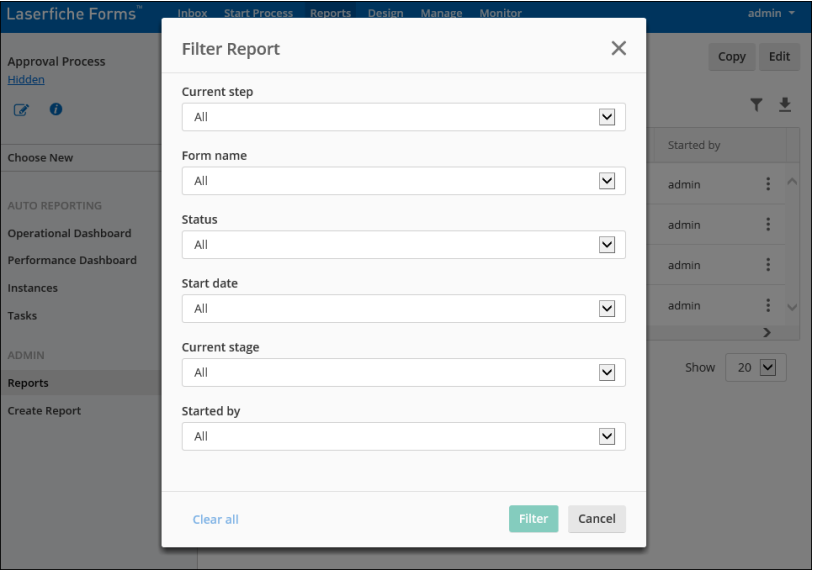
- Click the Filter button on the toolbar.
- Using any of the Step, Form name, Status, Start date, Current stage, and Started by drop-down lists, select the information you want shown in the list. When you have finished, click Filter.
Tip: Sort by a column by clicking it in the header. A down or up arrow will appear, based on whether the values are being sorted in ascending or descending order.
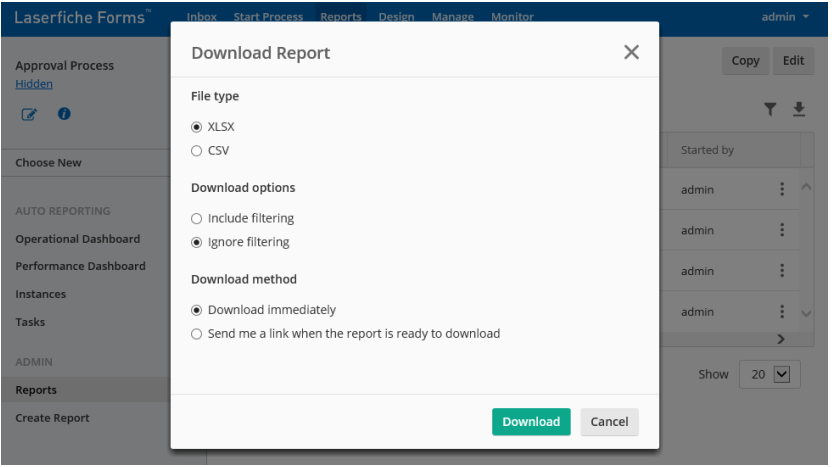
- Click the Download button on the toolbar.
- Under File type, select whether to download the instance list as an .xlsx or .csv file.
- Under Download options, select whether you want to include or ignore any filtering on the Results page when exporting the report.
- Under Download method, select Download immediately to immediately download the list. Or, select Send a link when the report is ready to download.
- When you are finished, click Download.
Tip: If the report is long, selecting Download immediately can significantly slow down your user experience because Forms will immediately create the file. To avoid the potential performance impact, select Send me a link when the report is ready to download. When this is selected, Laserfiche Forms will generate the file and send the link when it is finished, so user performance is not affected.


