Configuring Each Report Type
The first half of the report configuration page includes the details you provided in the previous wizard, like the processes in the report, the report name, and who can view the report. The second half includes specific details about the report, including the type of report, links to other variables, and filters on the report. This document details how you can create each chart type.
Tables
Tables details instance data as sortable columns on a table. For example, the following table is sorted by the Instance ID column:

To set up a table:
- Select the column you want to sort by in Sort By.
- Set up the order of the data for the column in Sort By under Sort Order.
- Specify the columns you want to display on the table with a column label in Columns.
- Click Create.
Columns and Bars
Columns and bars display categorical data as vertical and horizontal bars. For example, the following bar chart is categorized by start date:

To set up a column or bar chart:
- Provide a name for the chart in Chart Title. This is the name displayed at the top.
- Select the color of the bars in Color.
- Select the type of chart in Chart Type.
- Select the type of data you want displayed on the X-axis of the chart in Category. The instance ID count is on the Y-axis.
- Click Create.
Lines and Areas
Lines display numerical data as connected data points, while areas fill in the space between the connected points and the bottom axis. For example, the following area chart is categorized by start date:
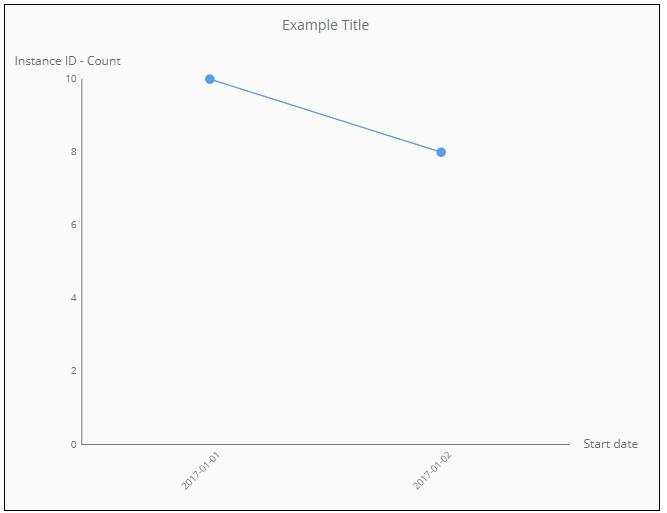
To set up a line or area chart:
- Type the name of the chart, displayed at the top, in Chart Title.
- Select the color of the shading in Color.
- Select the type of chart in Chart Type.
- Select the type of data you want displayed on the X-axis of the chart in Category. The instance ID count is on the Y-axis.
- Click Create.
Pies
Pies display segmented circular representations of instance data. When you hover over a part, you can view:
- The data in Category on the configuration page.
- The number of instances based on the Instance ID.
For example, the following multi-color pie chart is categorized by start date:
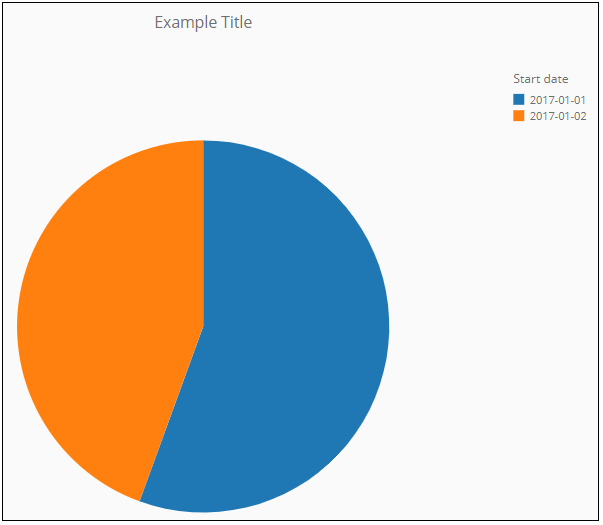
To set up a pie chart:
- Type the name of the chart, displayed at the top, in Chart Title.
- Select the color of the chart sections in Color.
- Select the type of data you want in the regions of the pie chart out of total number of instance IDs in Category.
- Click Create.
Funnels
Funnels display data as decreasing proportions and, like the pie chart, do not have axes. The height (not the area) represents the value of the data out of 100. When you hove over a part, you can view:
- The data in Category on the configuration page.
- The number of instances based on the Instance ID.
- A value that compares the select stage to the previous stage based on percentage decrease. For example, the percent of candidates who passed the review stage and were given an interview.
For example, the following multi-color funnel chart is categorized by start date:
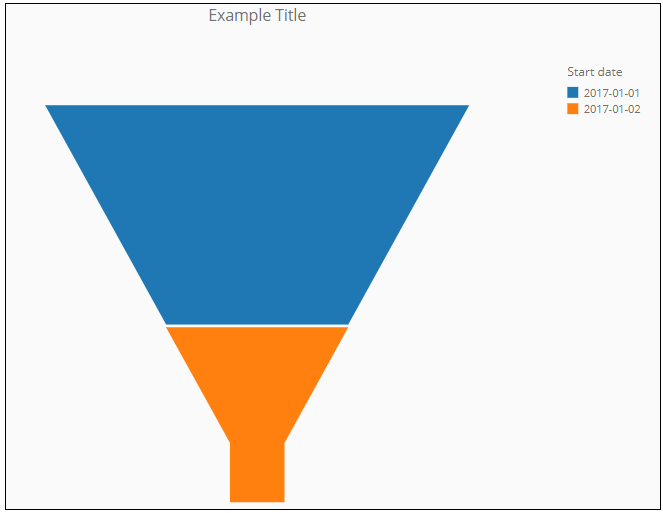
To set up a funnel chart:
- Type the name of the chart, displayed at the top, in Chart Title.
- Select the color of the chart sections in Color.
- Select the type of data you want in the regions of the pie chart out of total number of instance IDs in Category.
- Click Create.
Summarized
Summarized charts are aggregates of data into one report of any chart type. You configure this type as you would any other type and then specify how you want to group instances that have the same value. For example, the following summarized table chart has two columns grouped by start date:

To set up a summarized chart:
- Select the type of report.
- Select the instances to group values in Group Instances By. For example, the image above groups instances by start date.
- Select the type of data in the chart, along with the label for each column, in Summary Data Columns.
- Click Create.
Linking Variables
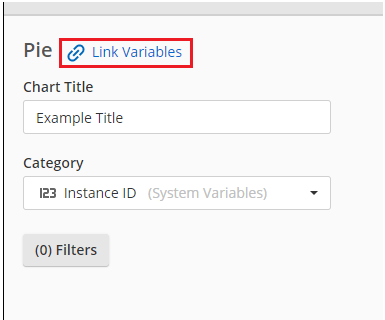
This option lets you link variables from different processes. The linked variables appear in the same category in a chart. For example, the following image shows a link for a variable in Process_1 and another in Process_2.
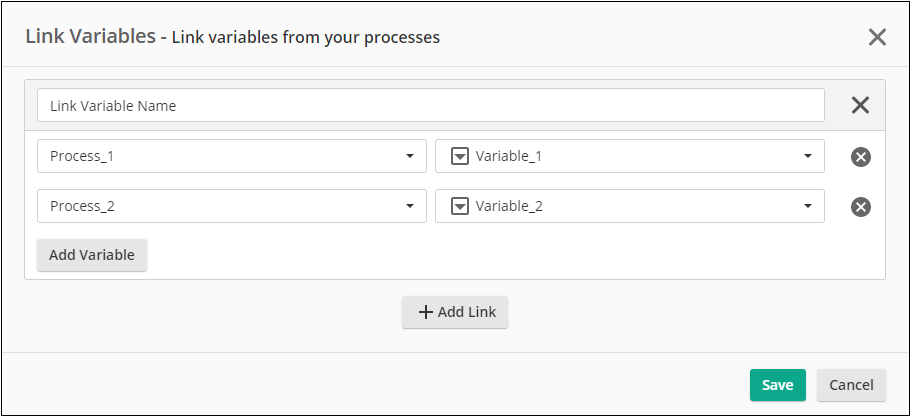
- In the configuration page, click Link Variables.
- Click Add Link.
- Type a name for the link.
- In the first drop-down, select a process.
- In the second drop-down, select a variable from the process. You can only use one variable from each process.
- Click Add Variable to add another variable.
- Optional: Click Add Link to add more link variables.
- Click Save.
Adding a Filter
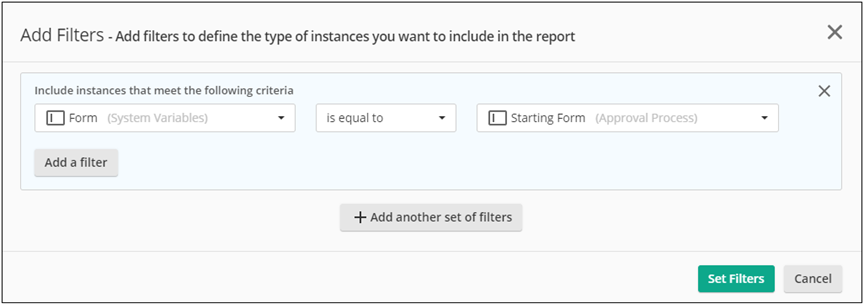
A filter lets you define the type of instances you want to include in the report. For example, to restrict the report to only instances that have a form with the name "Starting Form", add the following filter:
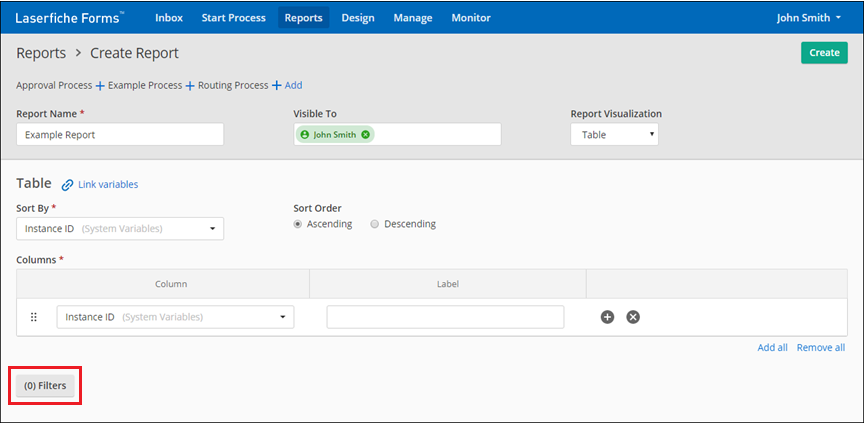
- In the Custom Reports Configuration page, click Filters.
- Click Add Filter.
- Set the criteria for the new filter.
- Optional: Click Add a filter in the box to add a condition to the filter.
- Optional: Click Add another set of filters to add another filter.
- Click Set Filters.
After you set the filter, the Filters button label will increment by 1 for each new filter.