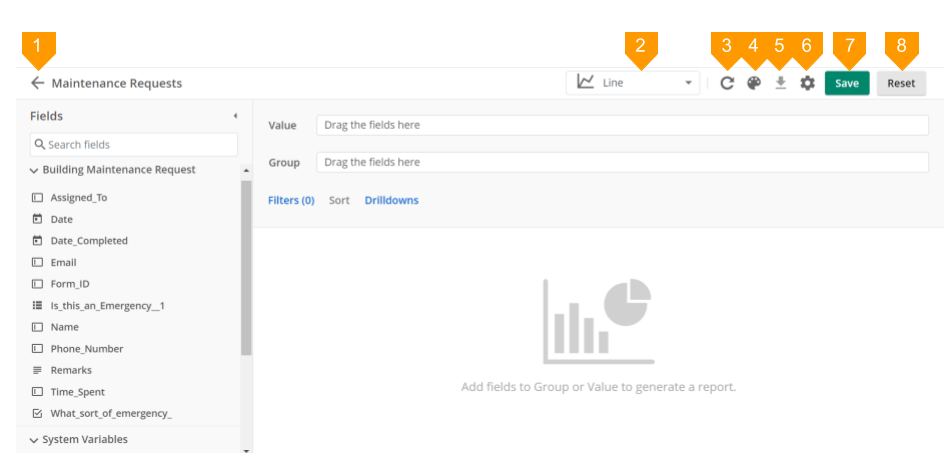
Custom Reports Toolbar Actions

- The arrow next to the report name will take you back to the Custom Reports main page.
- The chart type drop down allows you to select the type of chart to be displayed. The chart types are: Column, Line, Area, Bar, Pie, and Table. See Viewing Custom Reports for more information.
- The refresh button reloads the chart with the most recent process data.
- When a graphic chart style is used, the color palette button allows you to select and customize the colors of the chart.
- The download button allows you to export CSV and XLSX files for Table view, or PNG and PDF files for Chart views. The downloaded file can be shared or archived. See Viewing Custom Reports for more information.
- The report properties button allows you to adjust the name and description of the custom report, as well as view its process name.
- The save button saves the custom report to be used again later.
- The reset button restores the custom reports designer to its last saved state.