This tab displays the workflow statistics searched for in a workflow statistics report. Each workflow statistics report will open a new workflow statistics report results tab. You can export, organize, chart, and print these statistics from this tab.

The following statistics are shown about each workflow version returned by a workflow statistics report search:
- Workflow name, ID, and version number. (Each time you re-publish a workflow it is given a new version number. The first time you publish a workflow, it is version 1 of the workflow.)
- The total number of workflow instances of each version that the report returned.
- The number of running, completed, and terminated workflow instances of each workflow version.
- The maximum, minimum, and average time it took for a workflow version to run.
Note: Total Instances is not the total number of workflow instances for each version that exist, but rather the total number of instances the report returned for that version. For example, you have ten instances of a workflow: three instances are waiting, three are completed, and four are terminated. If you create a report for completed and terminated instances of the workflow, the Total Instances column will list seven instances, not ten instances.
Note: If you configure your workflow statistics report to only return workflow instances with specific statuses, only the columns for those statuses will be shown and all other status columns will be hidden. For example, if you search for all completed instances of a workflow (but not the terminated or running instances), the "Terminated Instances" and "Running Instances" columns will be hidden.
Opening a workflow statistics report tab
- Configure and run a workflow statistics report.
Tip: If multiple versions of a single workflow are included in the statistic results, a plus sign  will appear next to the workflow's name. Click the plus sign to view statistics for the workflow's versions. Click the minus button
  to collapse the workflow and hide the version statistics. Alternatively, you can use the right arrow key to expand a workflow or the left arrow key to collapse a workflow.
Sorting statistics
- Open a workflow statistics report results tab.
- Right-click anywhere in the tab.
- Point to Sort By.
- Select the column heading you want to organize the statistics by.
Tip: You can also sort statistics by clicking the column heading you want to organize the statistics by.
Reordering the horizontal order of statistics columns
- Click the name of a column.
- Drag it to a new position. As you drag the column, the blue insertion bar indicates where it will be inserted.
Showing or hiding statistic columns
- Open a workflow statistics report results tab.
- Right-click anywhere in the tab.
- Point to Show Columns.
- Select the columns you want to show, and clear the columns you want to hide.
Viewing statistics in a chart
- Open a workflow statistics report results tab with the statistics you want to chart.
- Select one or more rows of statistics you want to chart. (Hold down the CTRL key to select more than one row at a time.)
- Right-click anywhere in the tab.
- Point to View Chart.
- Select what statistics you want to view a chart of:
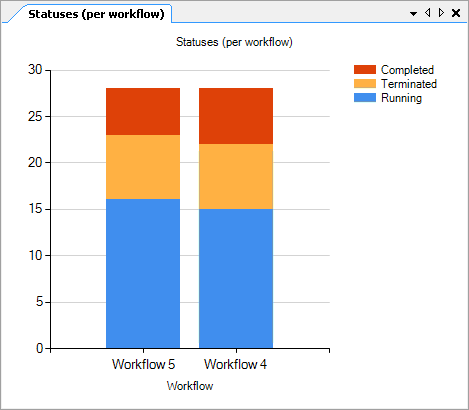
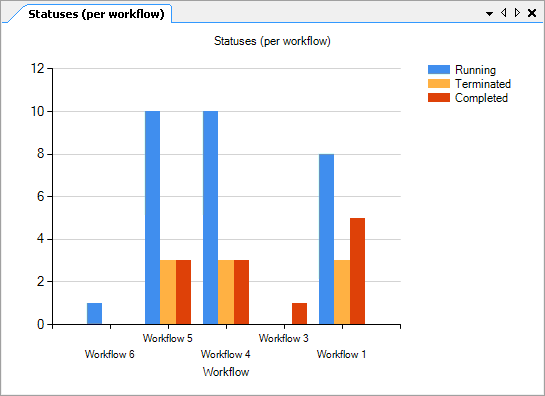
- The number of workflow instances with each status (running, completed, or terminated), organized by workflow, version, or user.
- How long it took for workflow instances to complete, organized by workflow or version.
- The number of workflow instances started over time, by workflow.
- A new tab will open and display a chart of the statistics you selected.
- Optional: Right-click the chart to make the following changes
- To rename the chart, select Chart name and type new name for the chart in the Chart Name dialog box. Click OK.
- To switch between stack columns and a bar chart (shown in the example above), select or clear Stack columns.
- To export the chart as an image file, select Export. Name the exported chart, browse to where you want to save it, and click Save.
- To print the chart, select Print. Alternatively, you can preview the chart before printing it by selecting Print Preview, or you can configure the paper selection, page orientation, and margins you want to be used when printing by selecting Page Setup.
- To change the color scheme of the chart, point to Colors and select a color palette.

Exporting statistics
- Open a workflow statistics report results tab with the statistics you want to export.
- Select one or more row of statistics you want to export. (Hold down the CTRL key to select more than one row at a time.)
- Right-click anywhere in the tab.
- Click Export.
- Name your exported statistics.
- Browse to where you want to save the statistics. Statistics will be saved as a .csv file.
- Click Save.
Copying statistics
- Open a workflow statistics report results tab with the statistics you want to copy.
- Select one or more row of statistics you want to copy. (Hold down the CTRL key to select more than one row at a time.)
- Right-click anywhere in the tab.
- Click Copy.
Refreshing or clearing statistics
- Open a workflow statistics report results tab.
- Right-click anywhere in the tab.
- Click Refresh to update the results to show any recent changes.
- Click Clear Results to remove all the results from the tab. You can restore cleared results by clicking Refresh. The restored results will be updated to show any recent changes.
